Writing

Notes from the projects on this site, written plainly and backed by the work itself.

Space Design System sales overview on a desktop monitor, with the phone layout beside it

Space Design System

Space: a design system for dashboards

Space: a design system for dashboards

How a Figma-to-Tableau kit grew into Space, a design system for dashboards in any BI tool.

The My Top Dogs web app on a laptop and a phone, three player silhouettes across its header.

My Top Dogs

Tableau held the numbers, not the story

Tableau held the numbers, not the story

Three fantasy picks, a Tableau dashboard that held the numbers, and a web-app redesign that tells the season in order.

A model district of lit towers and wind turbines on a dark desk, beside a monitor showing the same district’s energy dashboard.

Energy Dashboard

Tableau showed the load, not what to move

Tableau showed the load, not what to move

A Tableau energy concept that reported the load, rebuilt as a web app that shows what to move before the evening peak, with an original 3D district as its map.
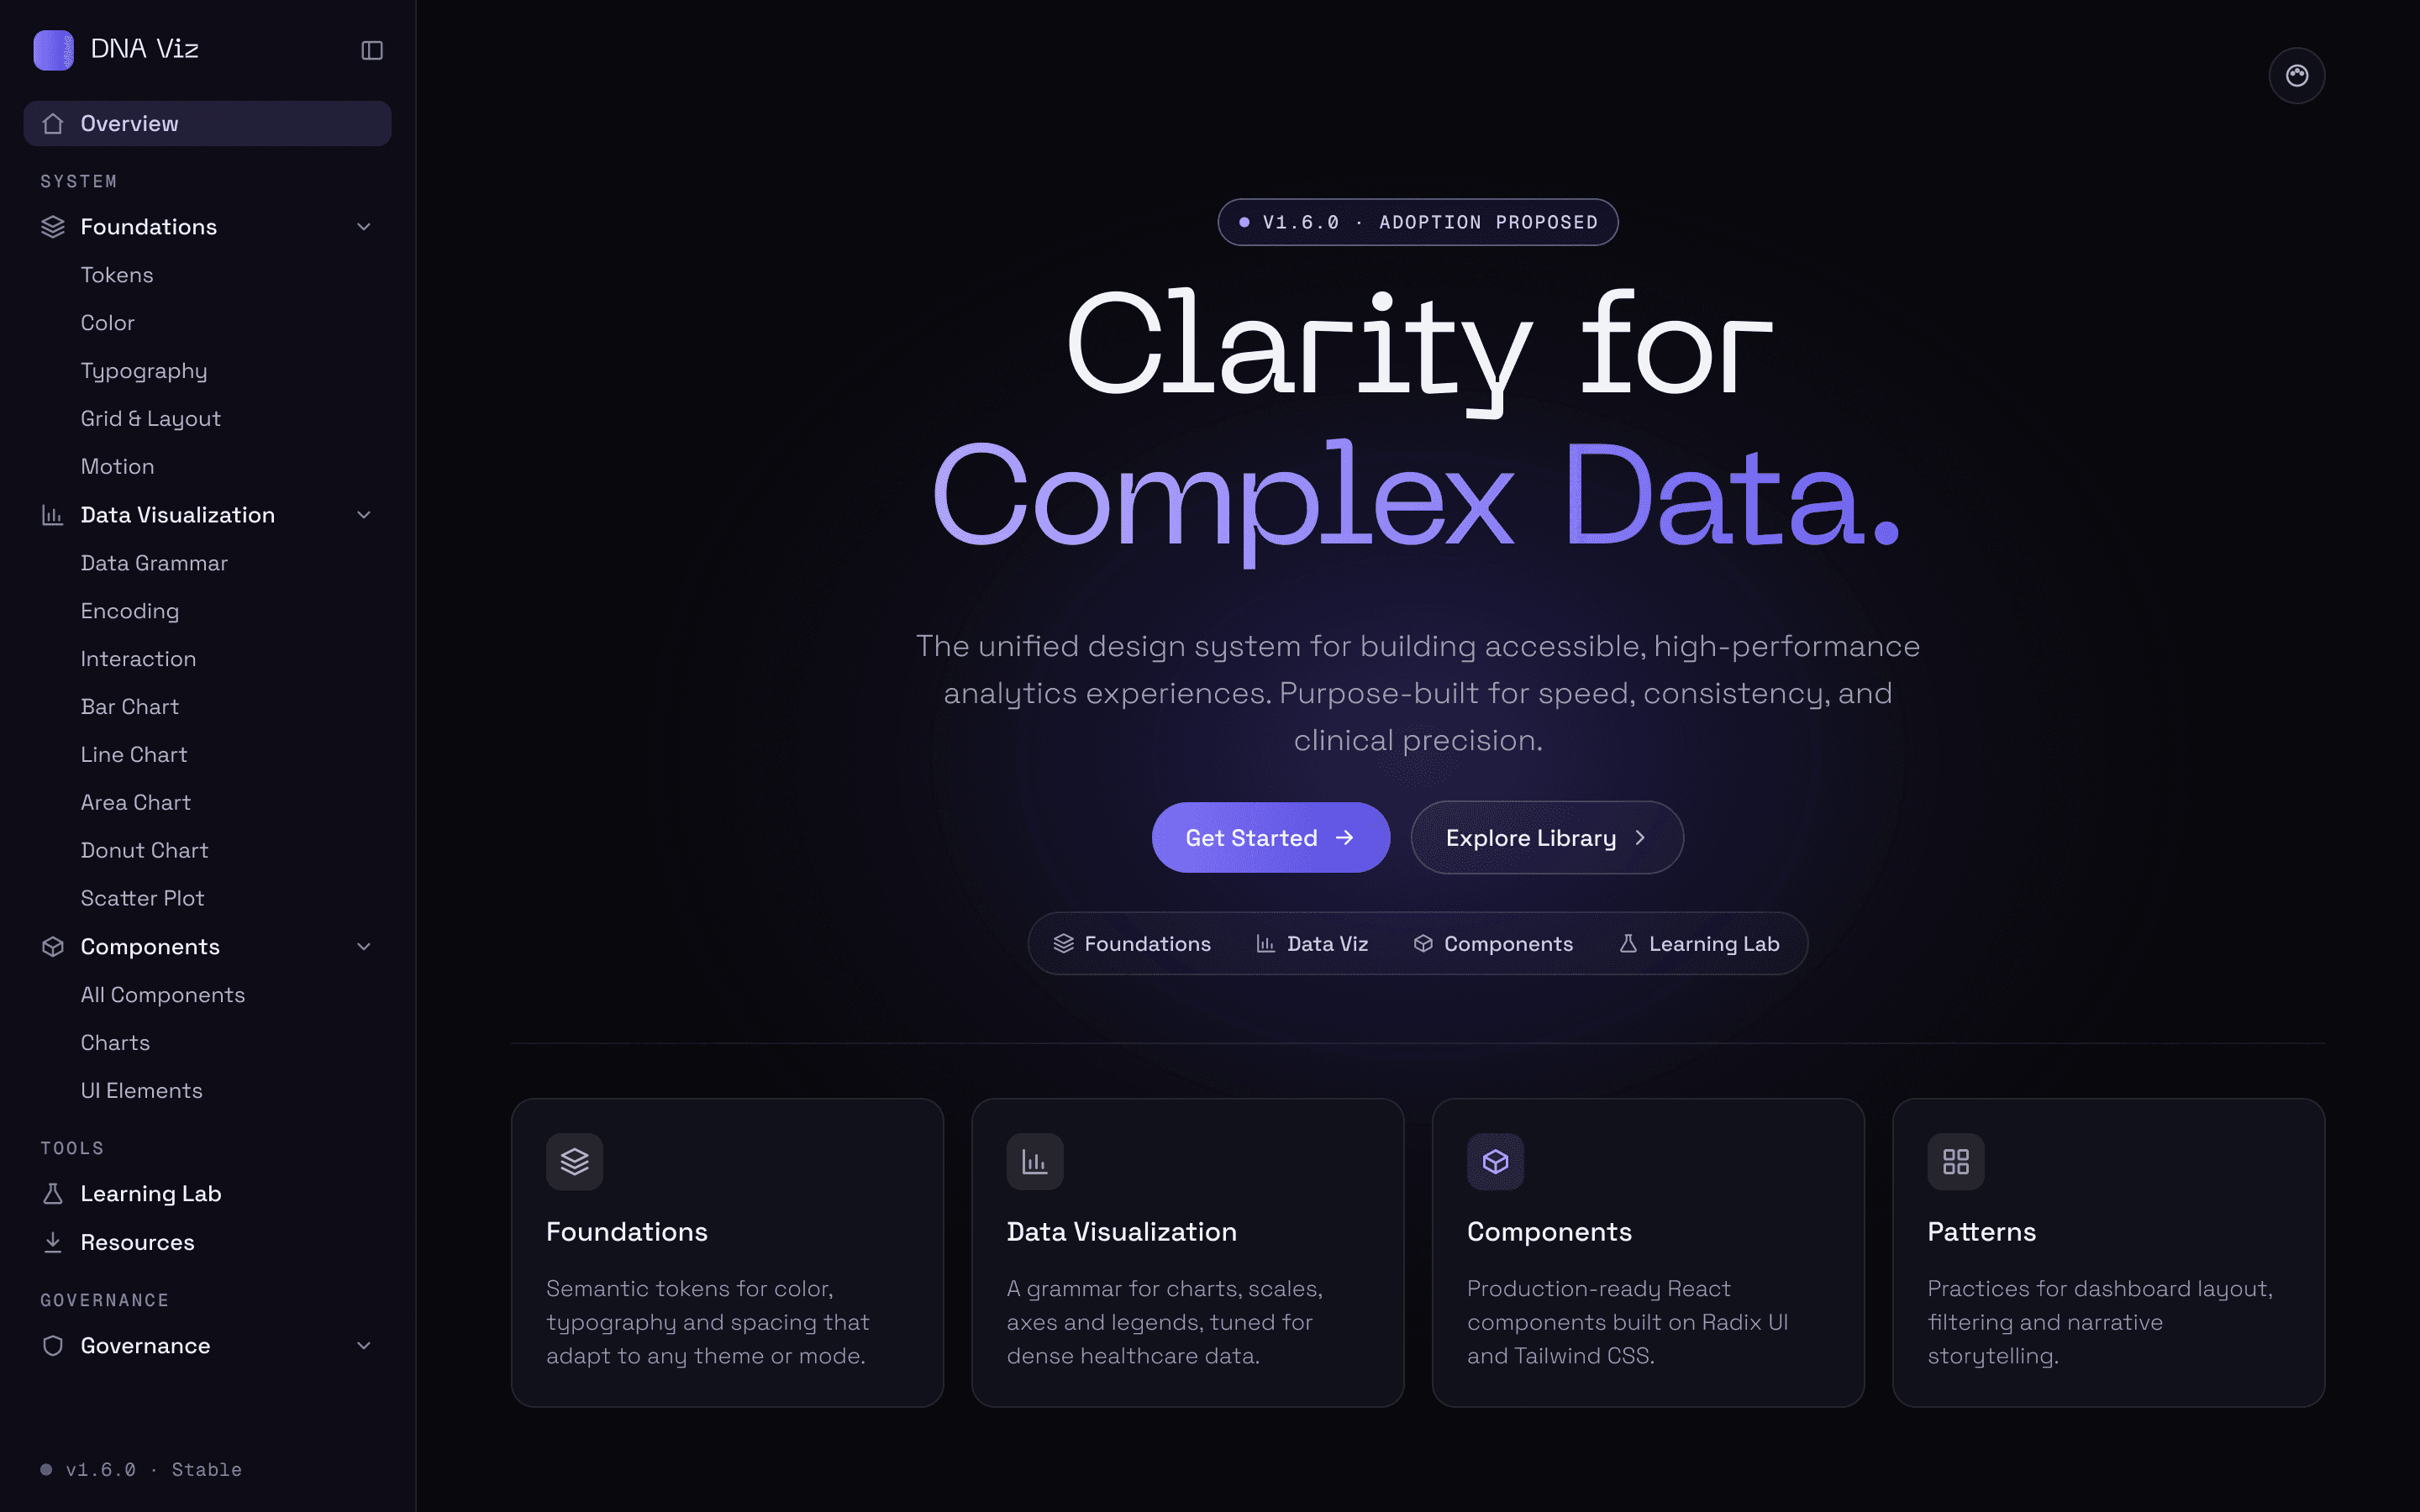
DNA Viz documentation site, Dark Ultra surface

DNA Viz

One visual language for every dashboard

One visual language for every dashboard

How DNA Viz gives every Surescripts dashboard one set of tokens and chart rules, so a number reads the same wherever it shows up.

StringLab home page on desktop, with the headline "Your pocket should feel like yours"

StringLab

Building a stringing service like a product

Building a stringing service like a product

How a one-person stringing service in Phoenix got the structure of a product, built around one record per pocket.

Lacrosse 26 redesigned Quick Play screen with two team cards facing each other in a stadium setting

Lacrosse 26

Redesigning game menus for a controller

Redesigning game menus for a controller

Why the Lacrosse 26 redesign started with an audit of every screen and button press, and what changed in Team Select and the lineup.

Before and after — reports scattered across Tableau, Looker, Workbench and email, then one governed catalog

Galaxy / Hubble

One report library, two audiences

One report library, two audiences

Staff and clients needed the same reports at different depths. Galaxy and Hubble put one catalog in front of every reporting tool.

Healthcare dashboard with KPI cards, a trend chart and a priority worklist, rebuilt with sample data

Healthcare Decision Intelligence

A dashboard should tell you what to do next

A dashboard should tell you what to do next

Designing First Fill so the numbers and the to-do list share one screen, then reusing that pattern across more healthcare dashboards.

The Byrne Method redesign homepage

The Byrne Method

The content was there. It needed a path.

The content was there. It needed a path.

A redesign concept for a lacrosse camp’s site, reorganised so every page answers one question a player or parent has.

VitaCore health results summary dashboard, sample data

Analytics Design & Delivery Study

A number on its own explains nothing

A number on its own explains nothing

Pairing every headline number in a health results summary with the chart that explains it, then carrying that down to a phone.

The pierrebyrne.com work page on desktop

This site

Building this portfolio with AI agents

Building this portfolio with AI agents

How I use AI agents to build and audit this site in Framer, and the rules that keep the work honest.

The modular Tableau dashboard template in its light theme, with a navigation menu, a customer table and a filter panel

Space Design System

Prototyping a Modular Tableau Dashboard in 3 Hours

Prototyping a Modular Tableau Dashboard in 3 Hours

A three-hour sandbox build: a modular Tableau dashboard with a collapsible sidebar, built mostly inside Tableau.

0