Space Design System
Space: a design system for dashboards

Pierre Byrne Designs

Tableau dashboards rarely look designed. They're built where the data lives, so layout, type and colour get decided last, one dashboard at a time. I wanted to design a dashboard in Figma first and have it arrive in Tableau intact.
Space is the design system I built to do that. I designed it on my own, in 2024 and 2025.
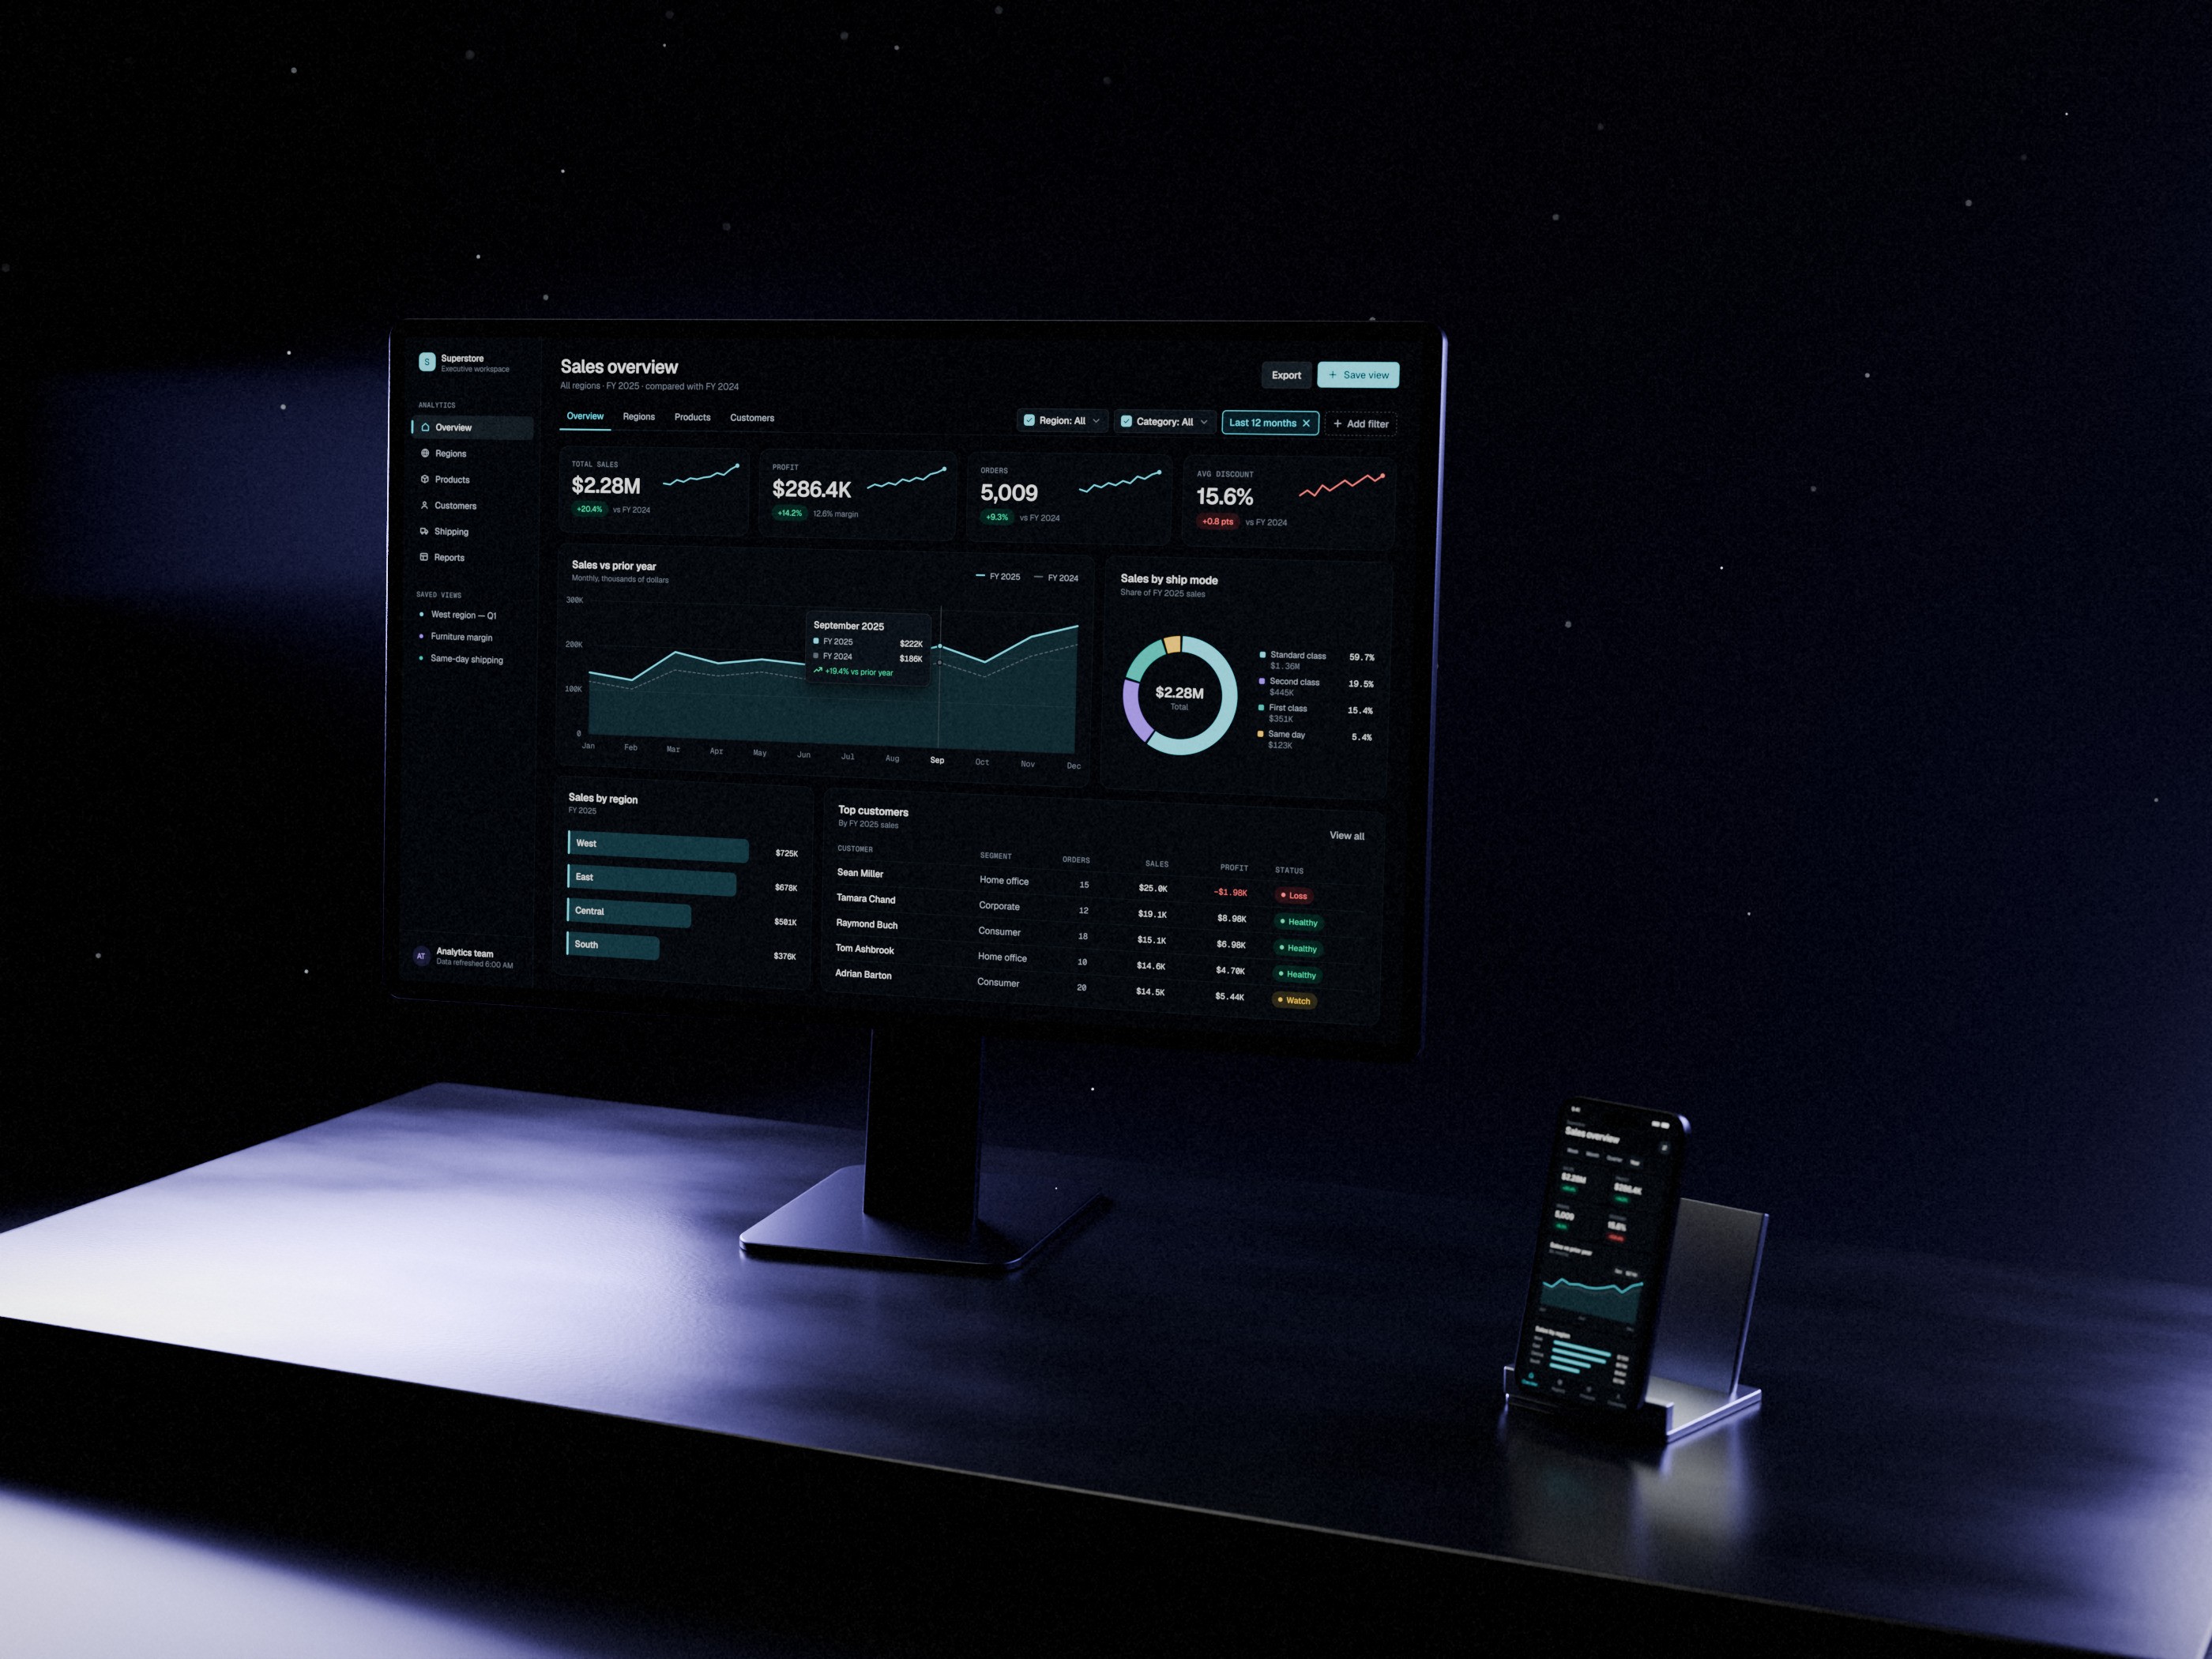
Design in Figma, in Tableau's terms
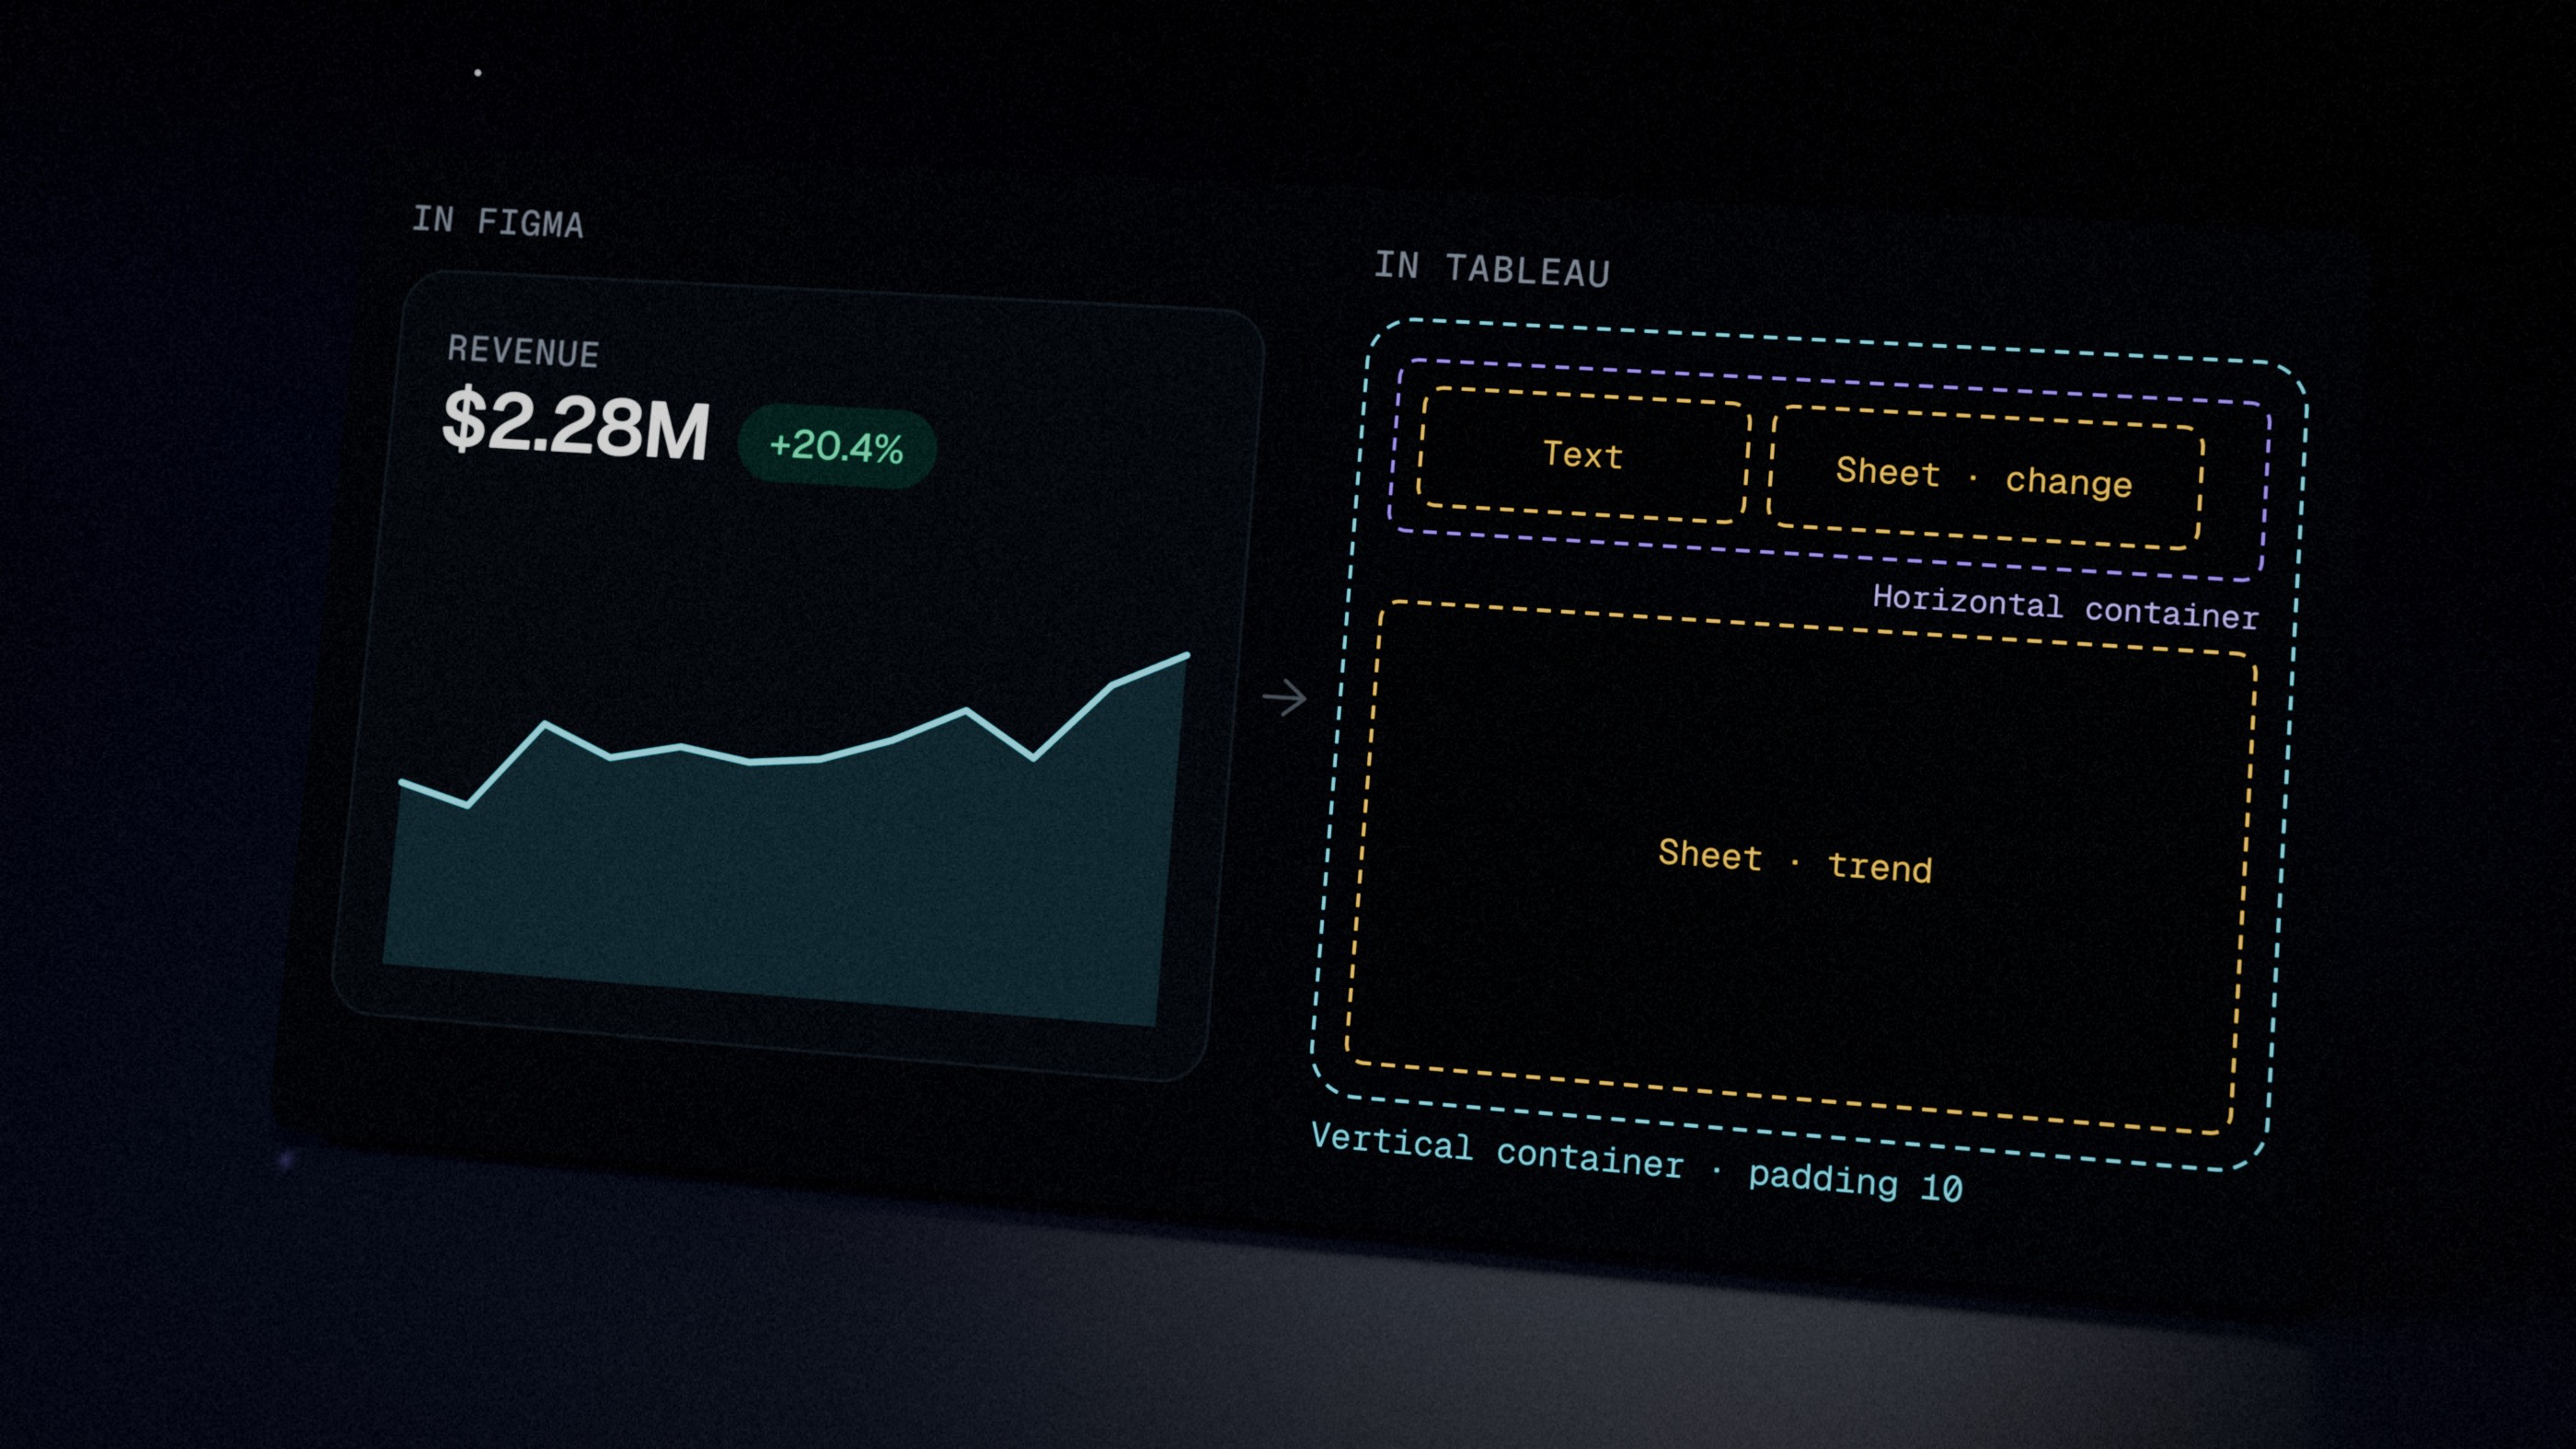
Every Space block is drawn the way Tableau lays out a dashboard: containers, sheets, text and blanks. An auto-layout frame is a container; a chart frame is a worksheet; padding is padding. When a block moves into Tableau, each layer already has a counterpart, so the build is a checklist rather than a translation.
The first build
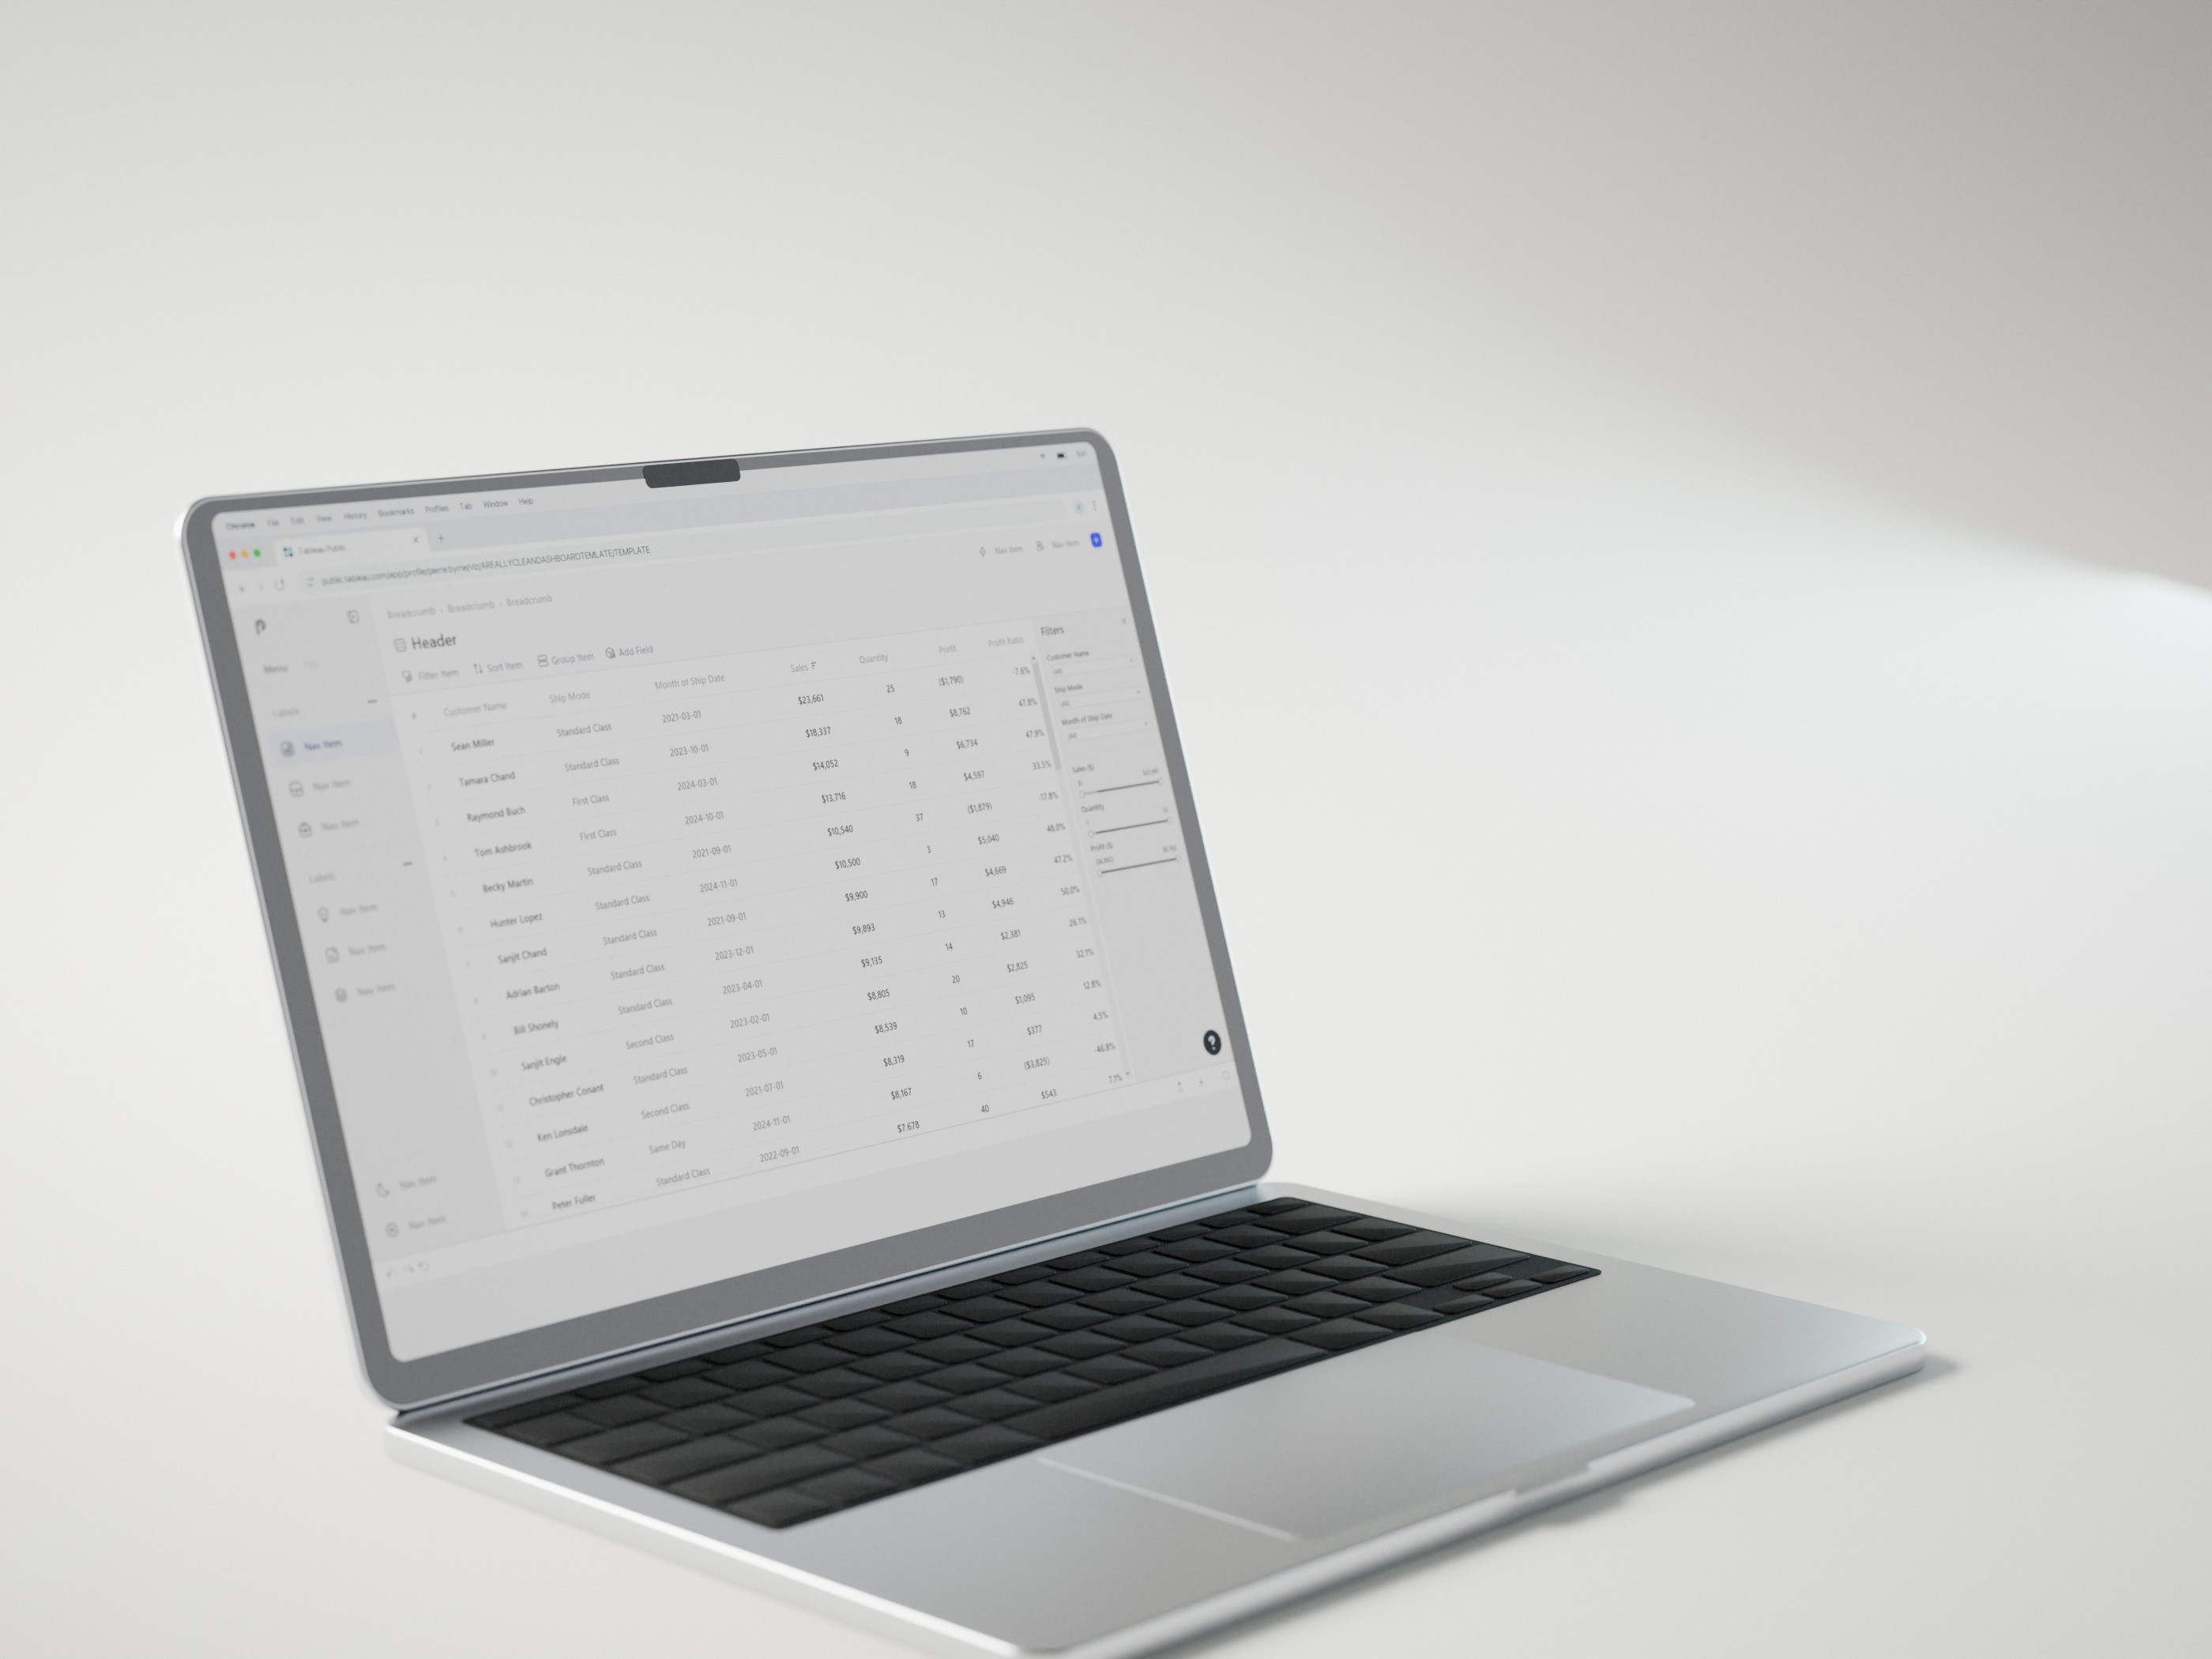
My first real test was a three-hour challenge: could a Tableau dashboard feel like an app? Space wasn't finished then, so the build leaned more on making Tableau feel like an app than on the system itself. It showed me what the system still needed.
Beyond Tableau
As the styling grew, and as I learned more about front-end UI, the scope grew too. Space stopped being a Figma-to-Tableau kit and became a system for any BI tool: foundations, components, chart blocks and the layouts that put them together.
Launchpad UX and Space Blocks
Launchpad UX and Space Blocks are where I catalogued BI visuals as reusable blocks: area, bar, donut, KPI, spark, table and more, each one repeatable and consistent. Tremor's blocks and La Data Viz were the inspiration. Every block is redrawn in Space's own styling.

One set of tokens, light and dark
Every colour in Space is a token with a dark and a light value. The light dashboard isn't a second design. It's the same frame, switched to the light mode.

Documented like a product
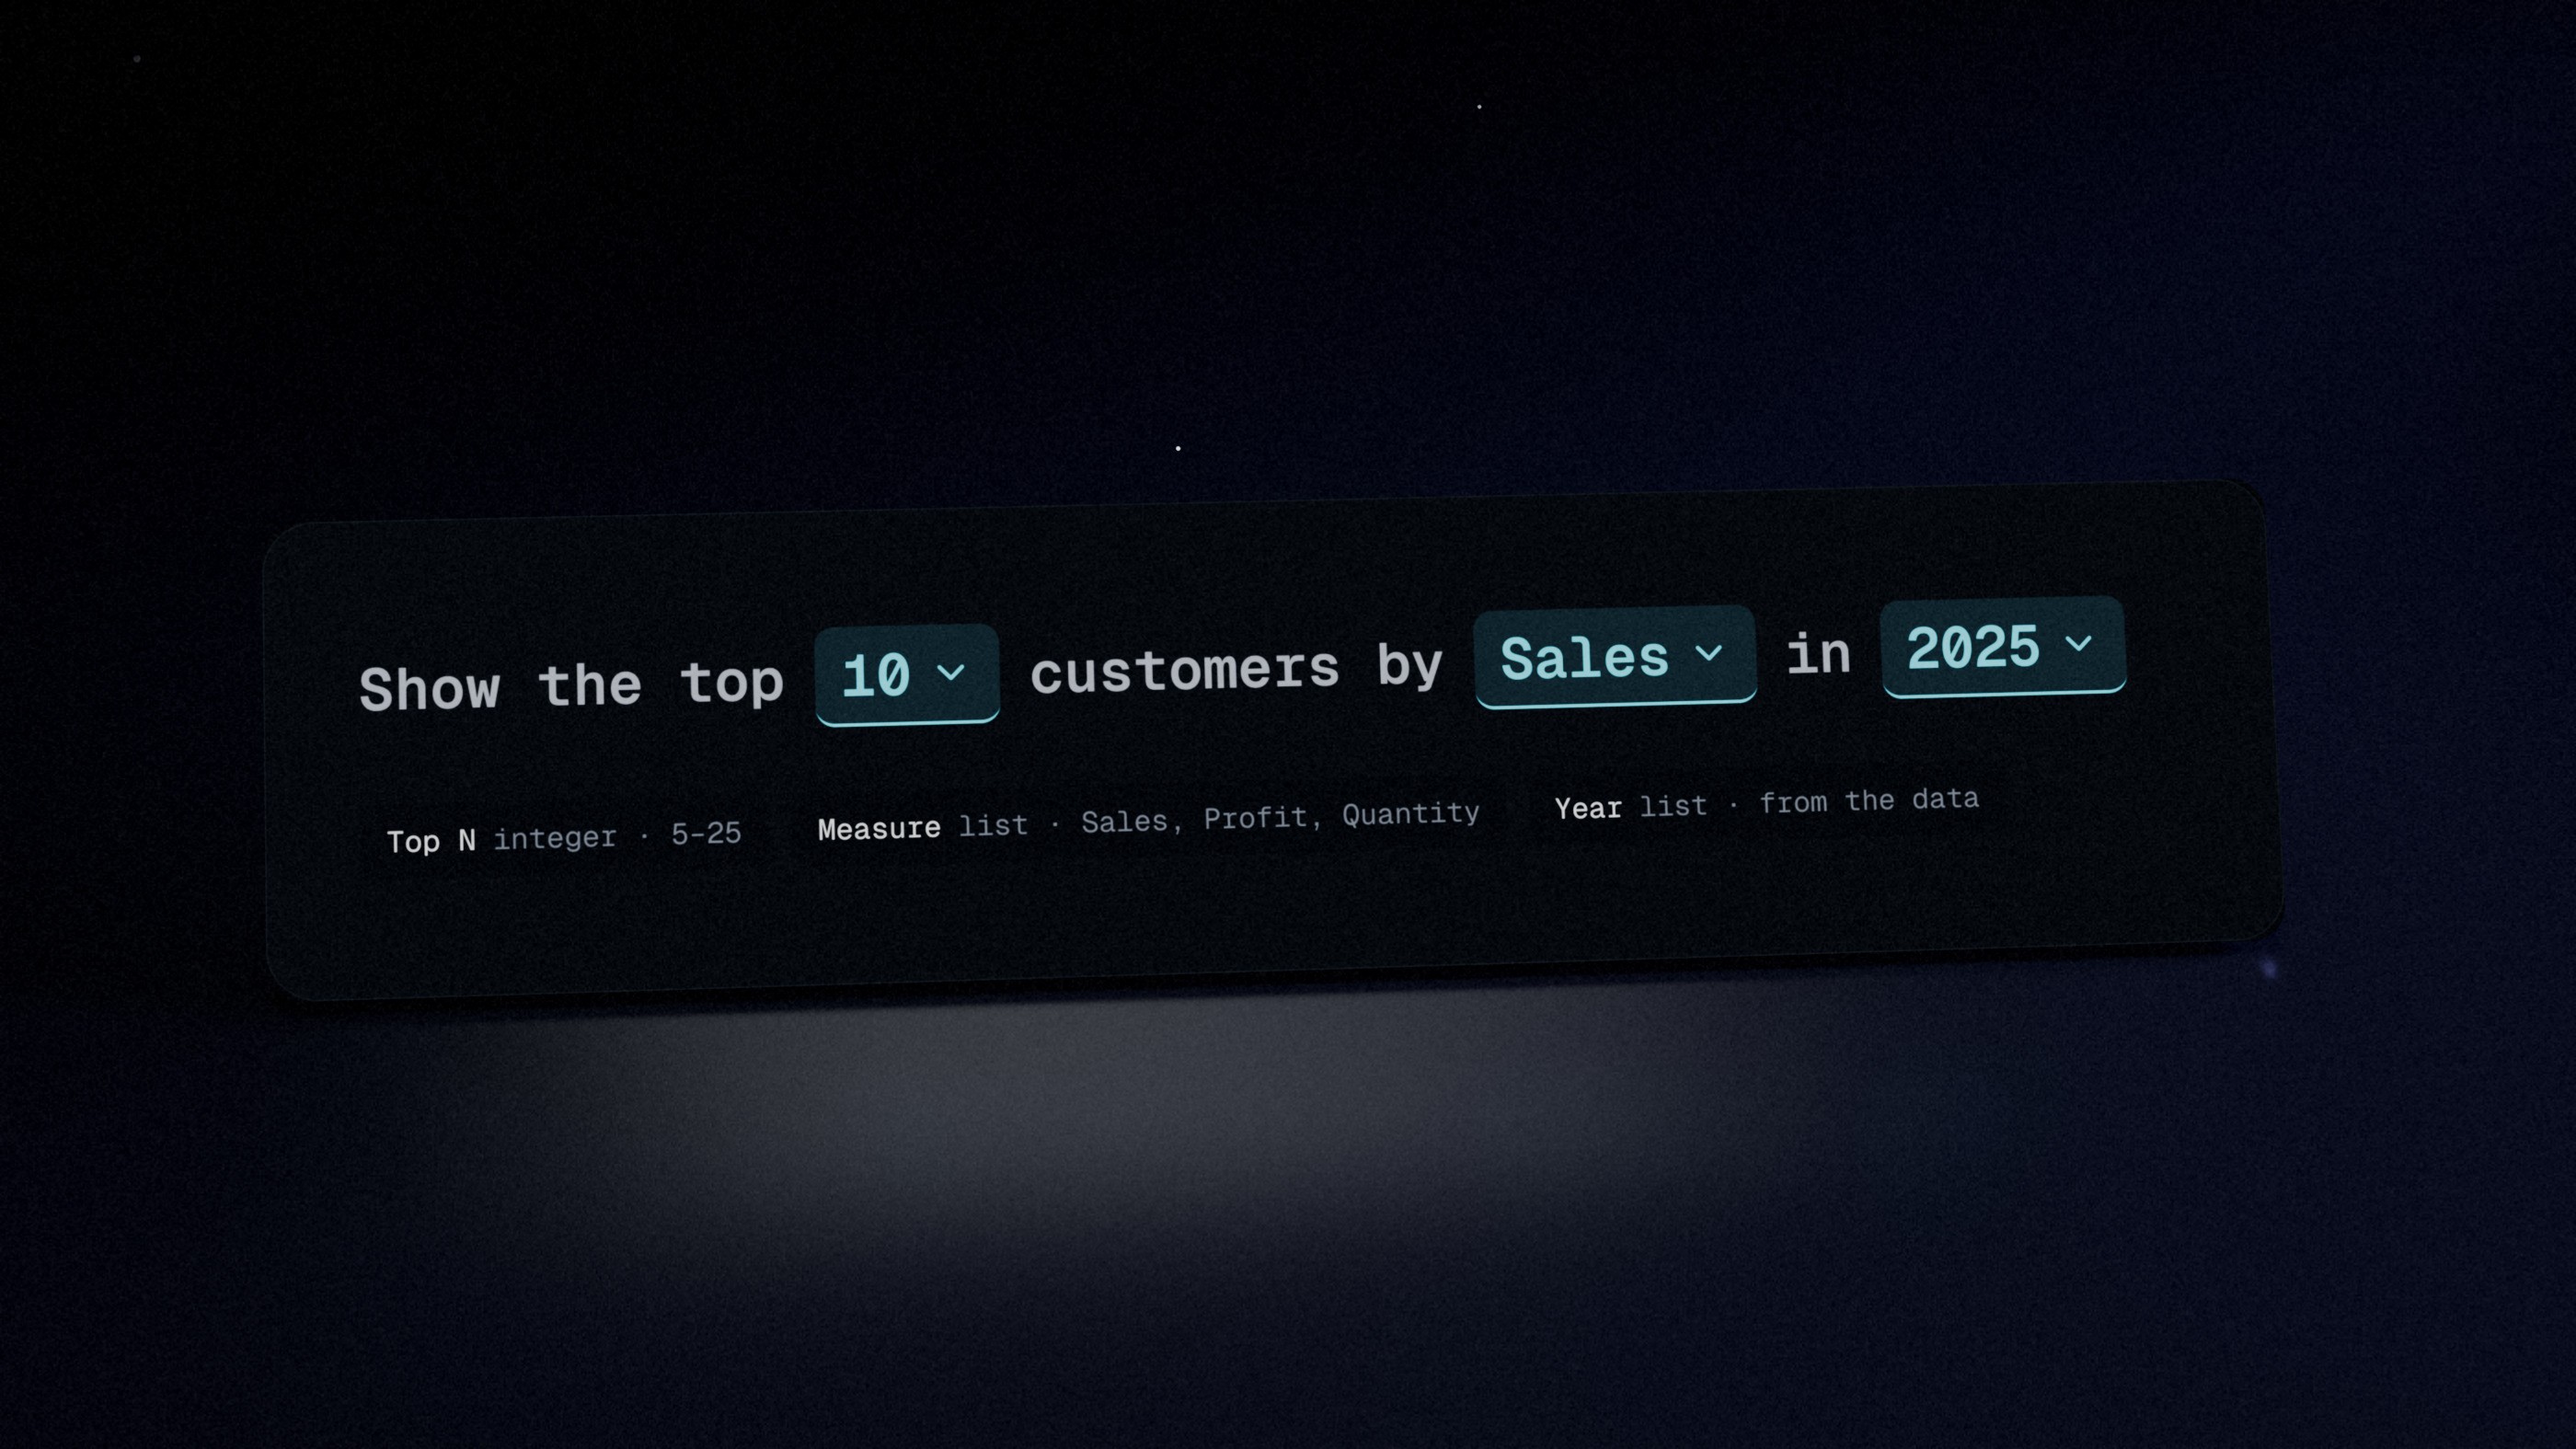
Each part has its own page: what it's for, its variants and states, and how to use it. Filters map one-to-one to Tableau's native filters, and parameters can be written straight into a sentence: "Show the top 10 customers by Sales in 2025."
About these screens
The dashboards use sample data in the style of Tableau's Superstore dataset.
From the case study