PUBLIC PRODUCT SYSTEM · TABLEAU

Designed in Figma, proved in Tableau

From a three-hour modular dashboard experiment to a reusable library of analytics blocks—designed in Figma, proved in Tableau.

From a three-hour sandbox to a reusable library of analytics blocks.

BLOCK LIBRARY · NINE PATTERN FAMILIESSystem anatomy
Atomic · 4 layers
01Foundations
02Components
03Chart patterns
04Templates
Layer 01 · FoundationsFoundations carry components.
Area
Bar
Composition
Tooltip
Donut
KPI
Line
Spark
Table

First, make Tableau feel like software.

A constrained three-hour sandbox tested whether parameters, containers, and modular navigation could behave like an app—not a report.

Dashboards. But Make It UI

Sidebar states, table actions, filters, and parameter controls established the interaction grammar.

PUBLIC PROTOTYPE · 2025

Dashboards. But Make It UI

Sidebar states, table actions, filters, and parameter controls established the interaction grammar.

PUBLIC PROTOTYPE · 2025

Then, turn the experiment into reusable parts.

The strongest behaviors became named, browsable blocks that designers can compose before implementation.
A browsable block library

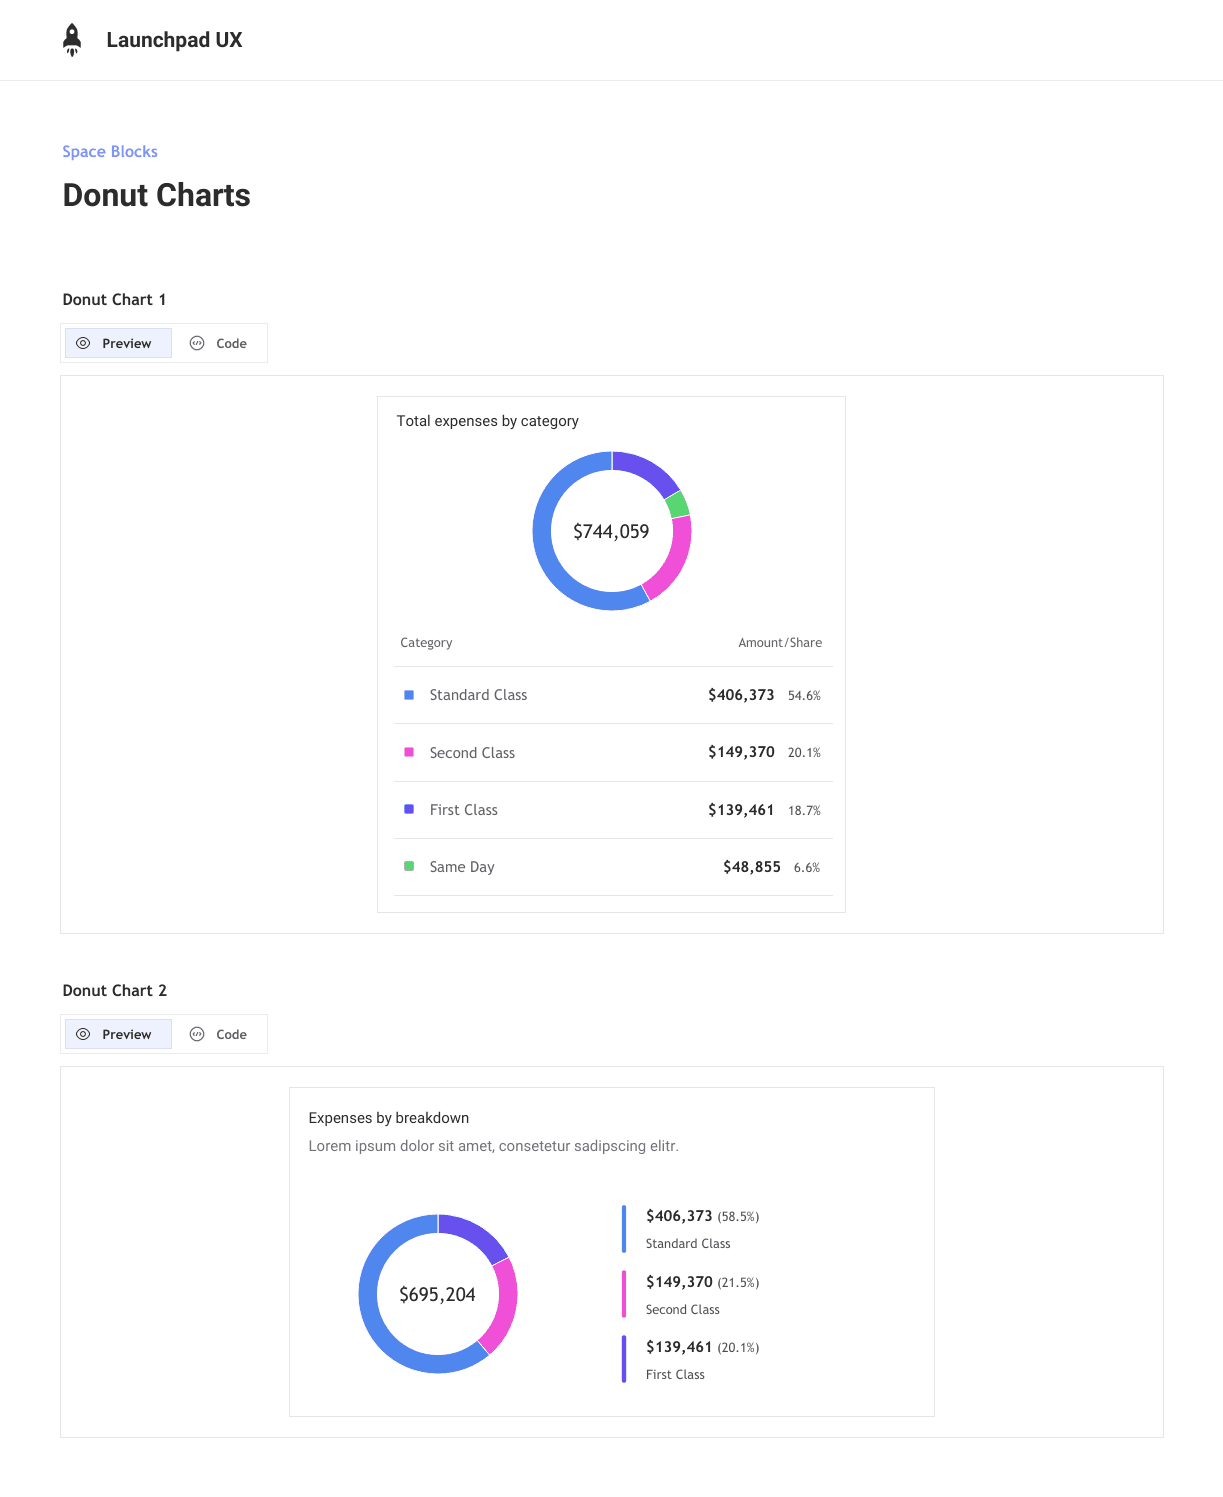
Area, bar, composition, tooltip, donut, KPI, line, spark, and table patterns create a shared vocabulary for dashboard work.

LAUNCHPAD UX · SPACE BLOCKS

A browsable block library

Area, bar, composition, tooltip, donut, KPI, line, spark, and table patterns create a shared vocabulary for dashboard work.

LAUNCHPAD UX · SPACE BLOCKS

Four layers, built so a Figma frame and a Tableau container agree.

The kit follows atomic design: foundations carry components, components carry chart patterns, and templates assemble all three. Each layer answers to a Tableau constraint rather than a general design ideal.

Layer 01

Foundations

The rules every other layer inherits. Nothing above this can drift without breaking here first.

Contains · 4
Color paletteTypographySpacingLayout rules
Tableau constraint

Built on a responsive 8pt grid that mirrors Tableau's native layout constraints, so a Figma frame and a Tableau container agree on the same measurements.

The system exists in public, not just in Figma.

Two live Tableau workbooks and a documented build trail make the design logic inspectable.

2

A modular interface prototype and a reusable block library are live on Tableau Public.

2

A modular interface prototype and a reusable block library are live on Tableau Public.

9

Nine chart and dashboard pattern families translate the visual language into reusable blocks.

9

Nine chart and dashboard pattern families translate the visual language into reusable blocks.

3h

The app-like Tableau precursor was built as a time-boxed public sandbox.

3h

The app-like Tableau precursor was built as a time-boxed public sandbox.

The visual discipline extends into distinct dashboard studies.

These are separate projects—not protected work-product redesigns—and remain linked rather than folded into this case study.

Energy Dashboard Mockup

A conceptual dark-mode dashboard study exploring calm executive density and modular information panels.

EXPERIMENTAL VISUAL SYSTEMS

Energy Dashboard Mockup

A conceptual dark-mode dashboard study exploring calm executive density and modular information panels.

EXPERIMENTAL VISUAL SYSTEMS

My Top Dogs

A fantasy football comparison experience exploring hierarchy, narrative, and player evaluation. Public release remains gated by imagery review.

SPORTS ANALYTICS · RIGHTS REVIEW

My Top Dogs

A fantasy football comparison experience exploring hierarchy, narrative, and player evaluation. Public release remains gated by imagery review.

SPORTS ANALYTICS · RIGHTS REVIEW

0