DNA VIZ DESIGN SYSTEM · V1.6.0

Change a token once
and every dashboard follows.

One visual language for every Surescripts dashboard, built in five layers that each draw only from the one below.

  1. 01Tokens182
  2. 02Semantic roles5 tiers
  3. 03Chart primitives5
  4. 04Components19
  5. 05Dashboards4 rebuilt
Color, type and spacing, including 15 data-viz scales.
Role
Designed and built the system end to end, solo
Scope
182 tokens and 19 components
Status
v1.6.0 · adoption proposed to enterprise UX
Platform
React · Recharts · Tableau · Figma

Every chart has to answer a clinical question.

DNA gives every dashboard one set of tokens and chart rules, so a number reads the same wherever it shows up.
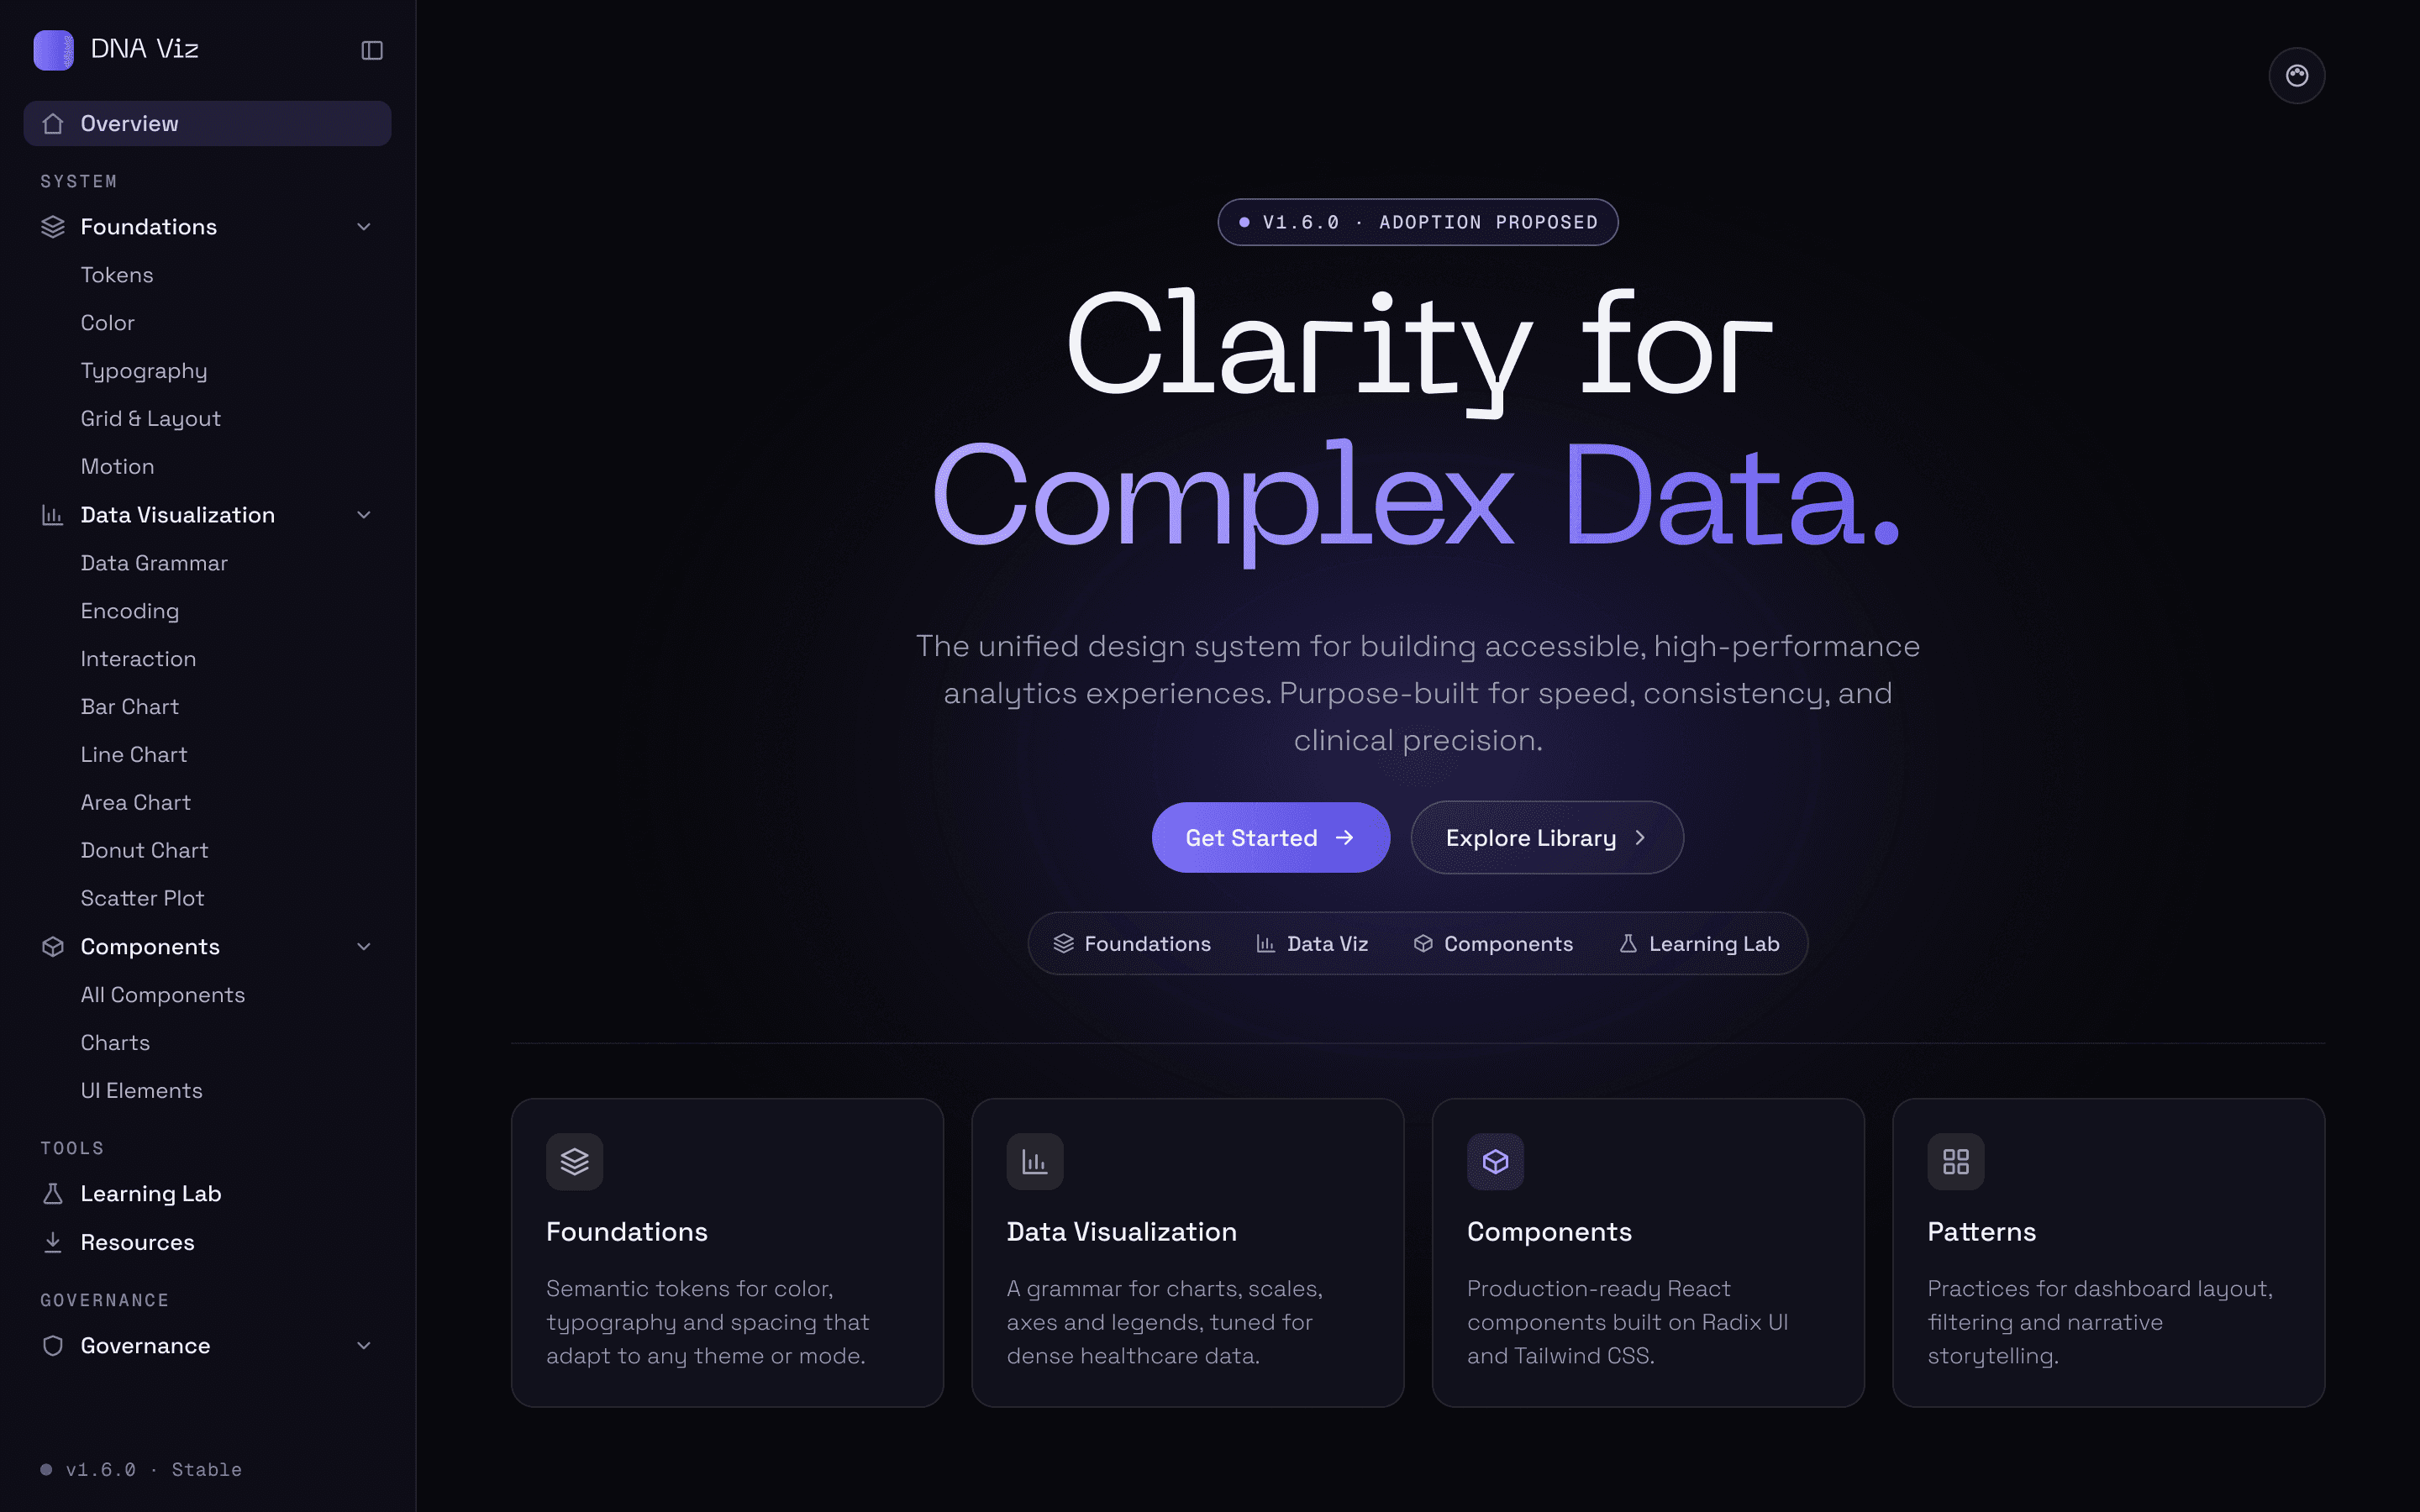
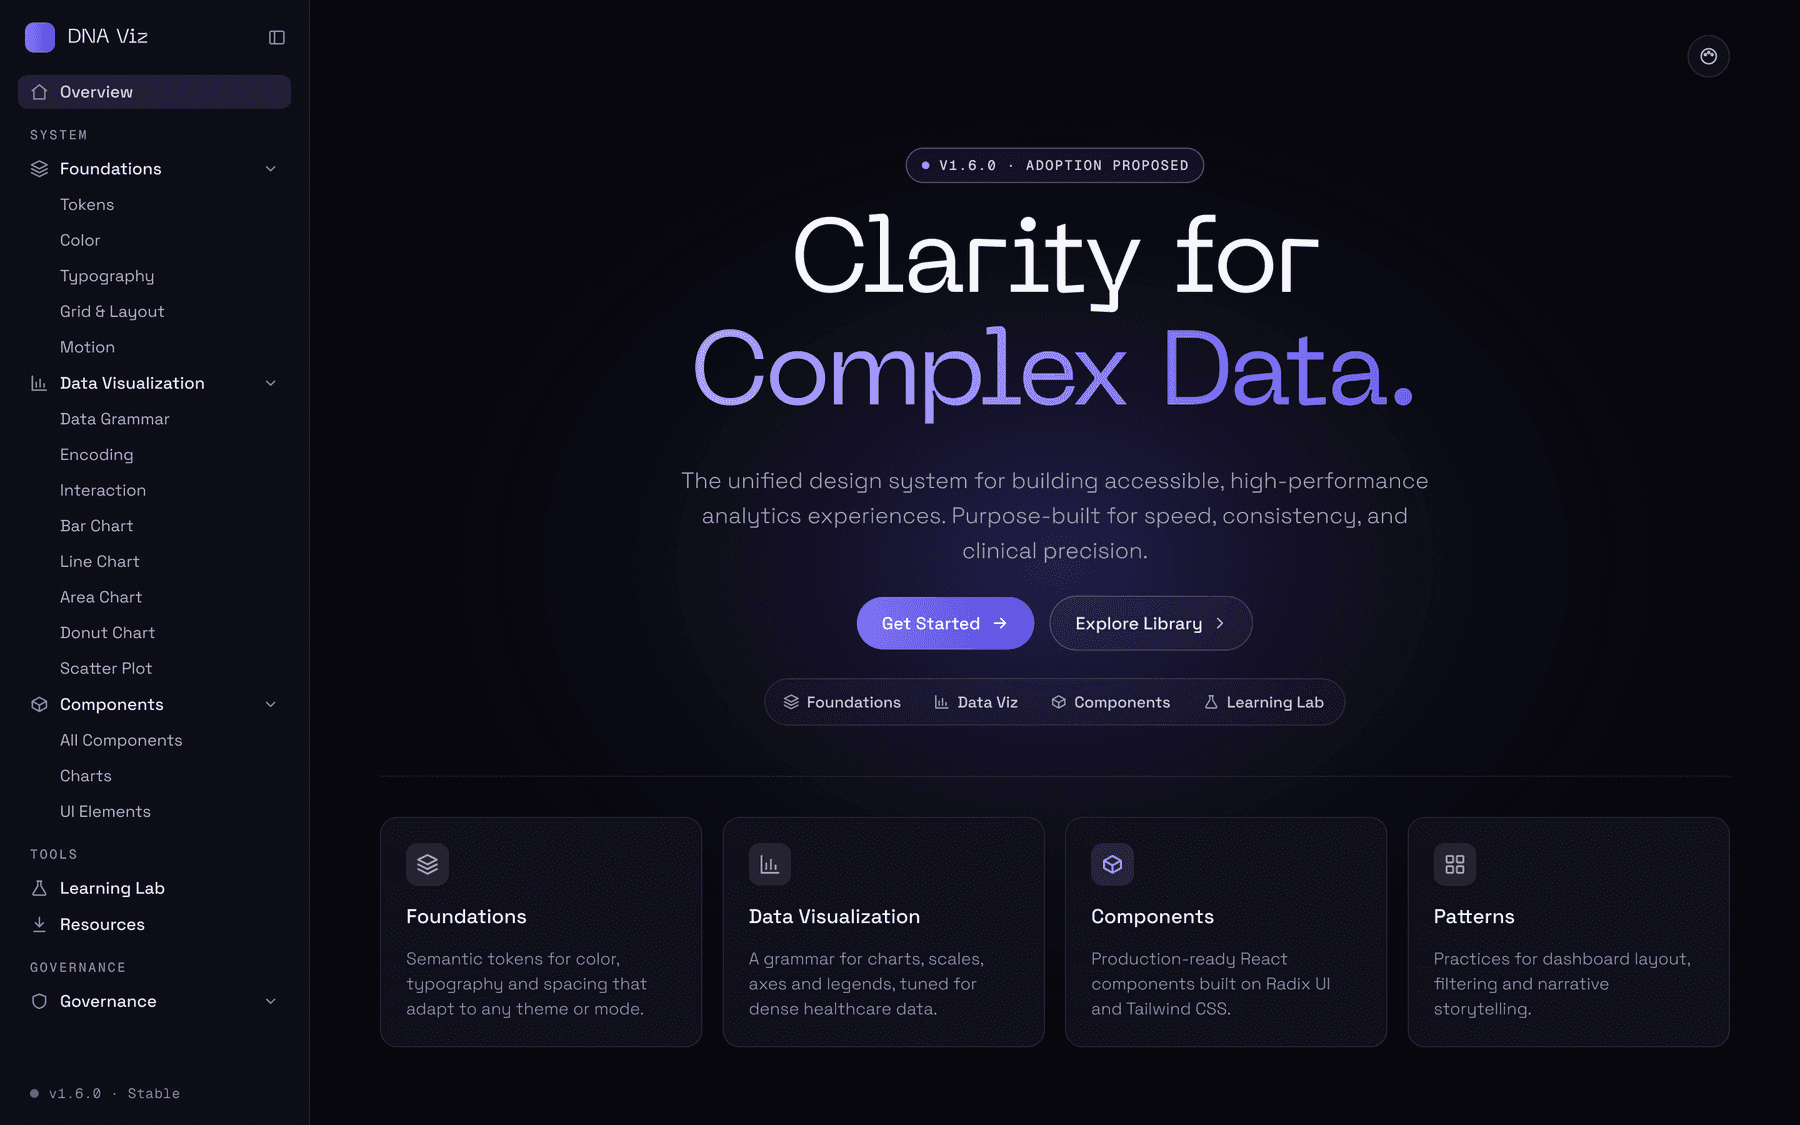
DNA Viz documentation site in Dark Ultra: the overview page with the headline Clarity for Complex Data and cards for foundations, data visualization, components and patterns

The documentation site, Dark Ultra surface

DNA VIZ · REBUILT FROM THE ORIGINAL

The documentation site, Dark Ultra surface

The documentation site, Dark Ultra surface

DNA VIZ · REBUILT FROM THE ORIGINAL

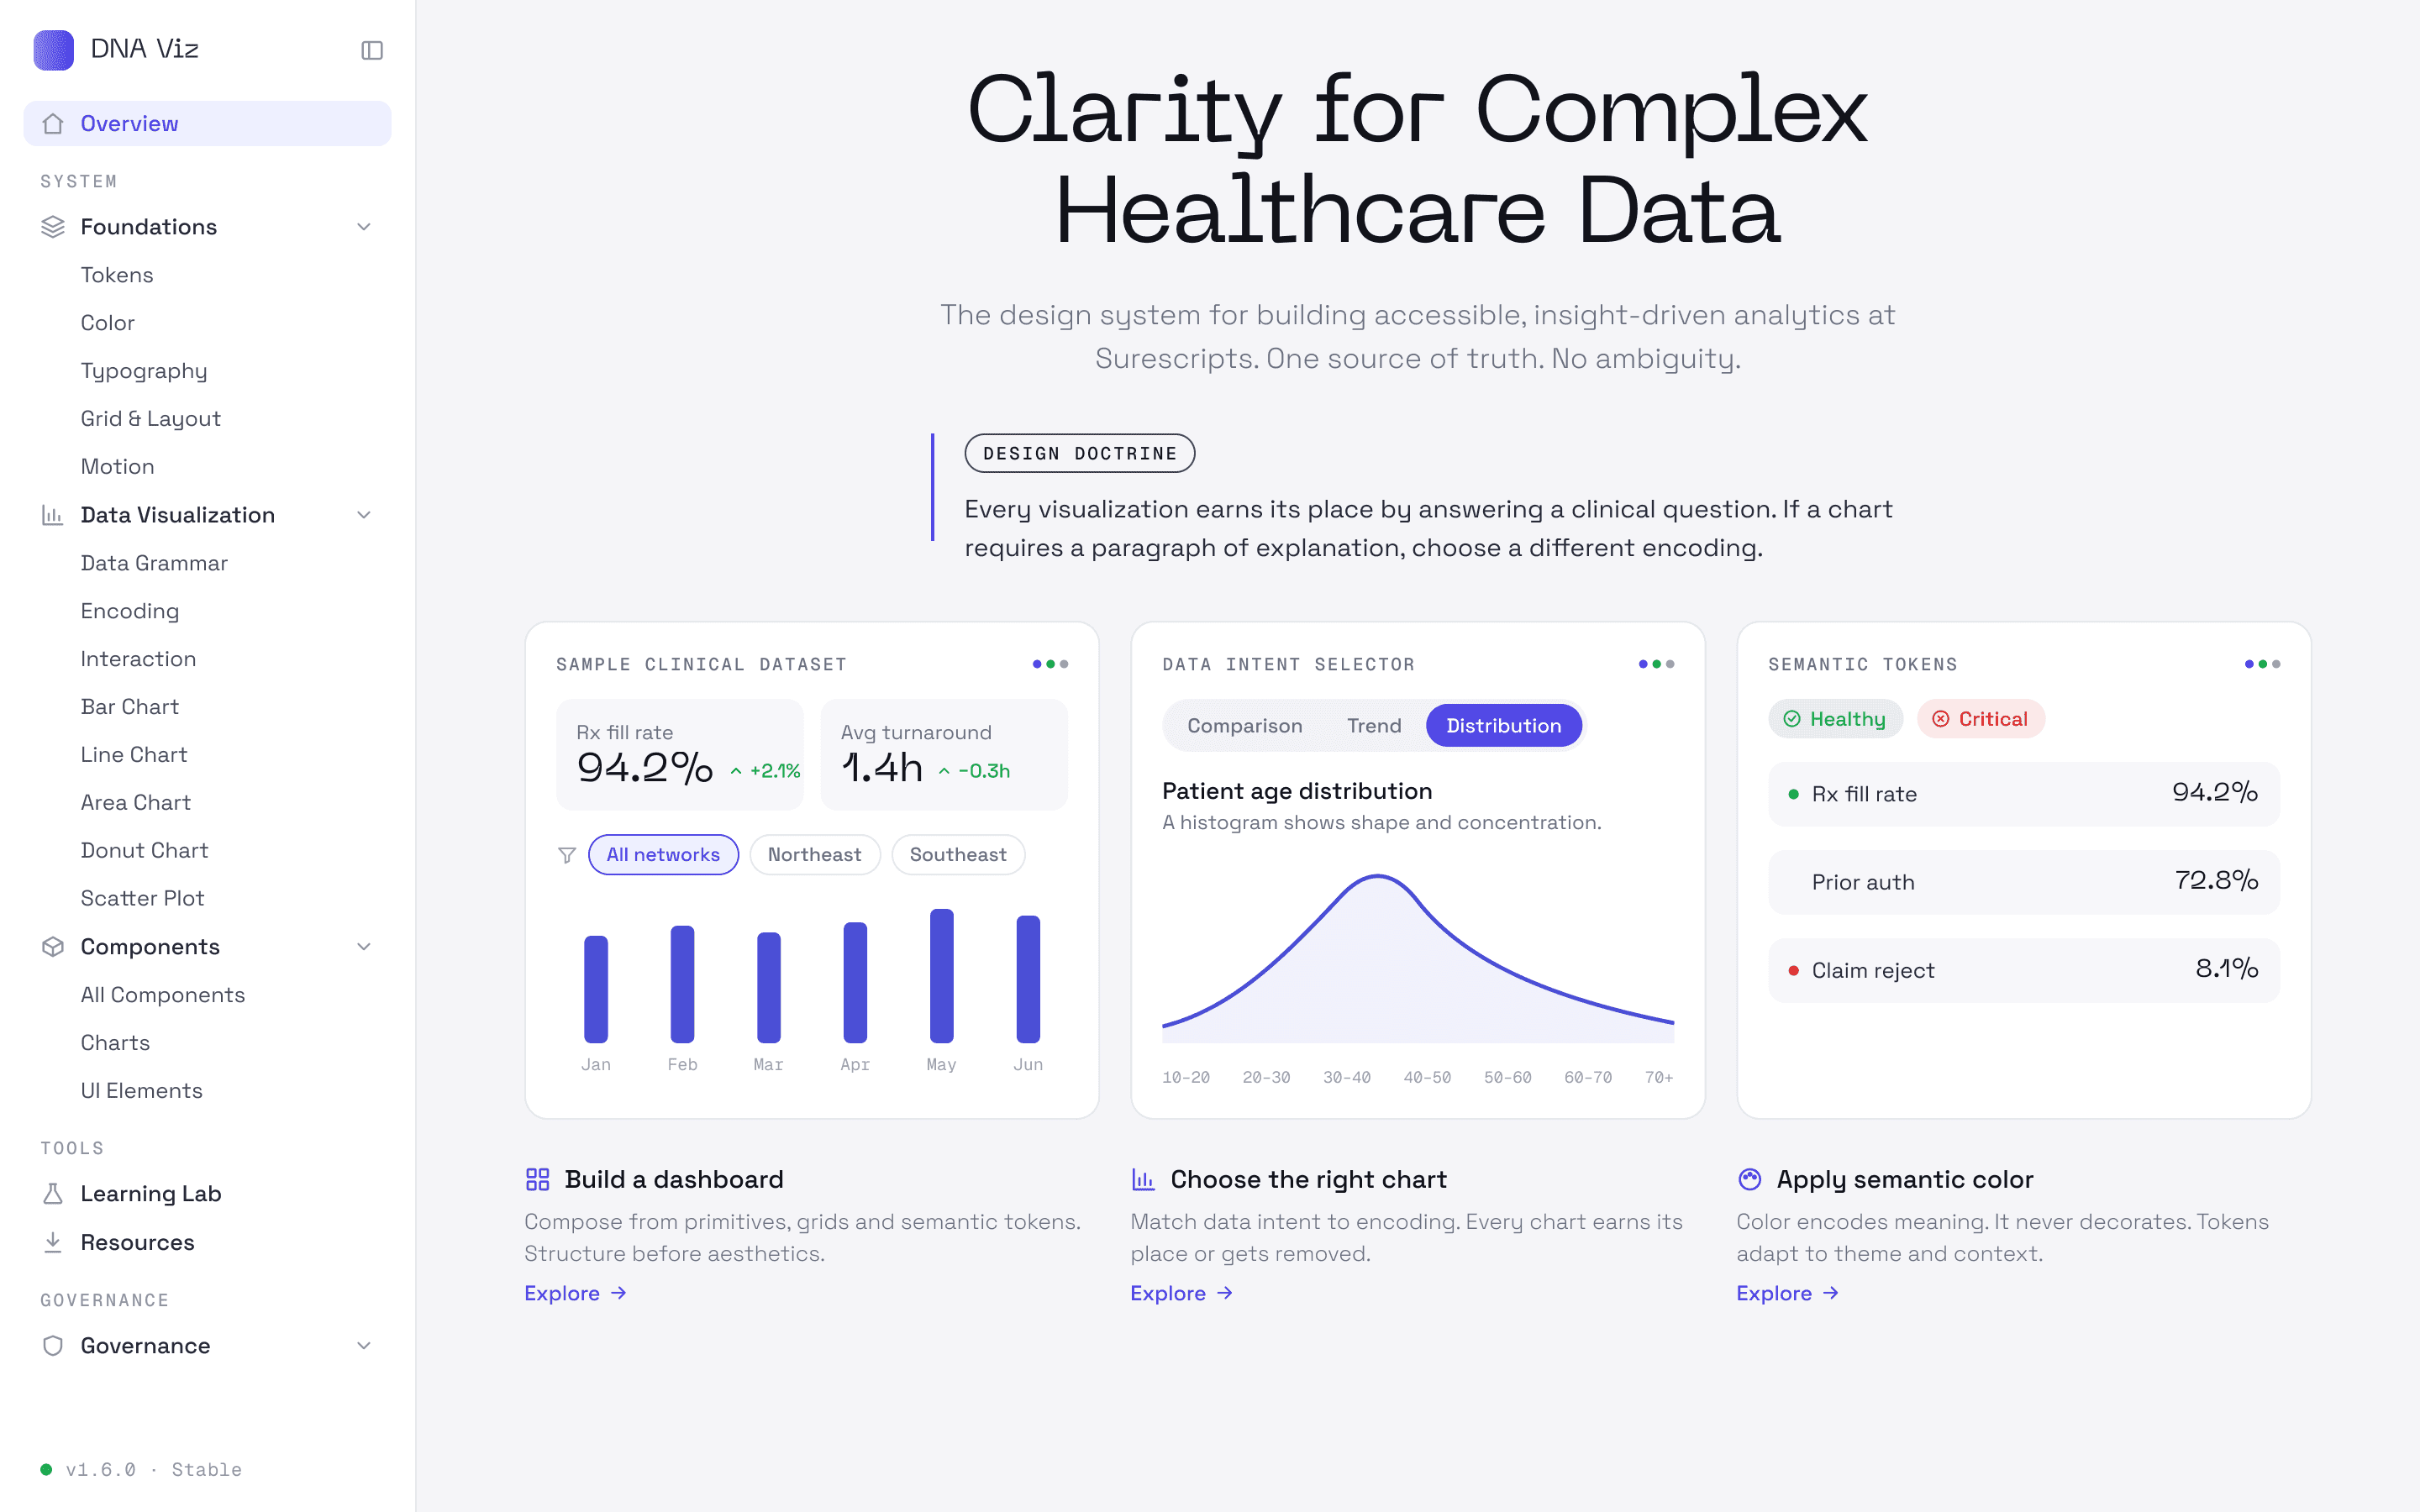
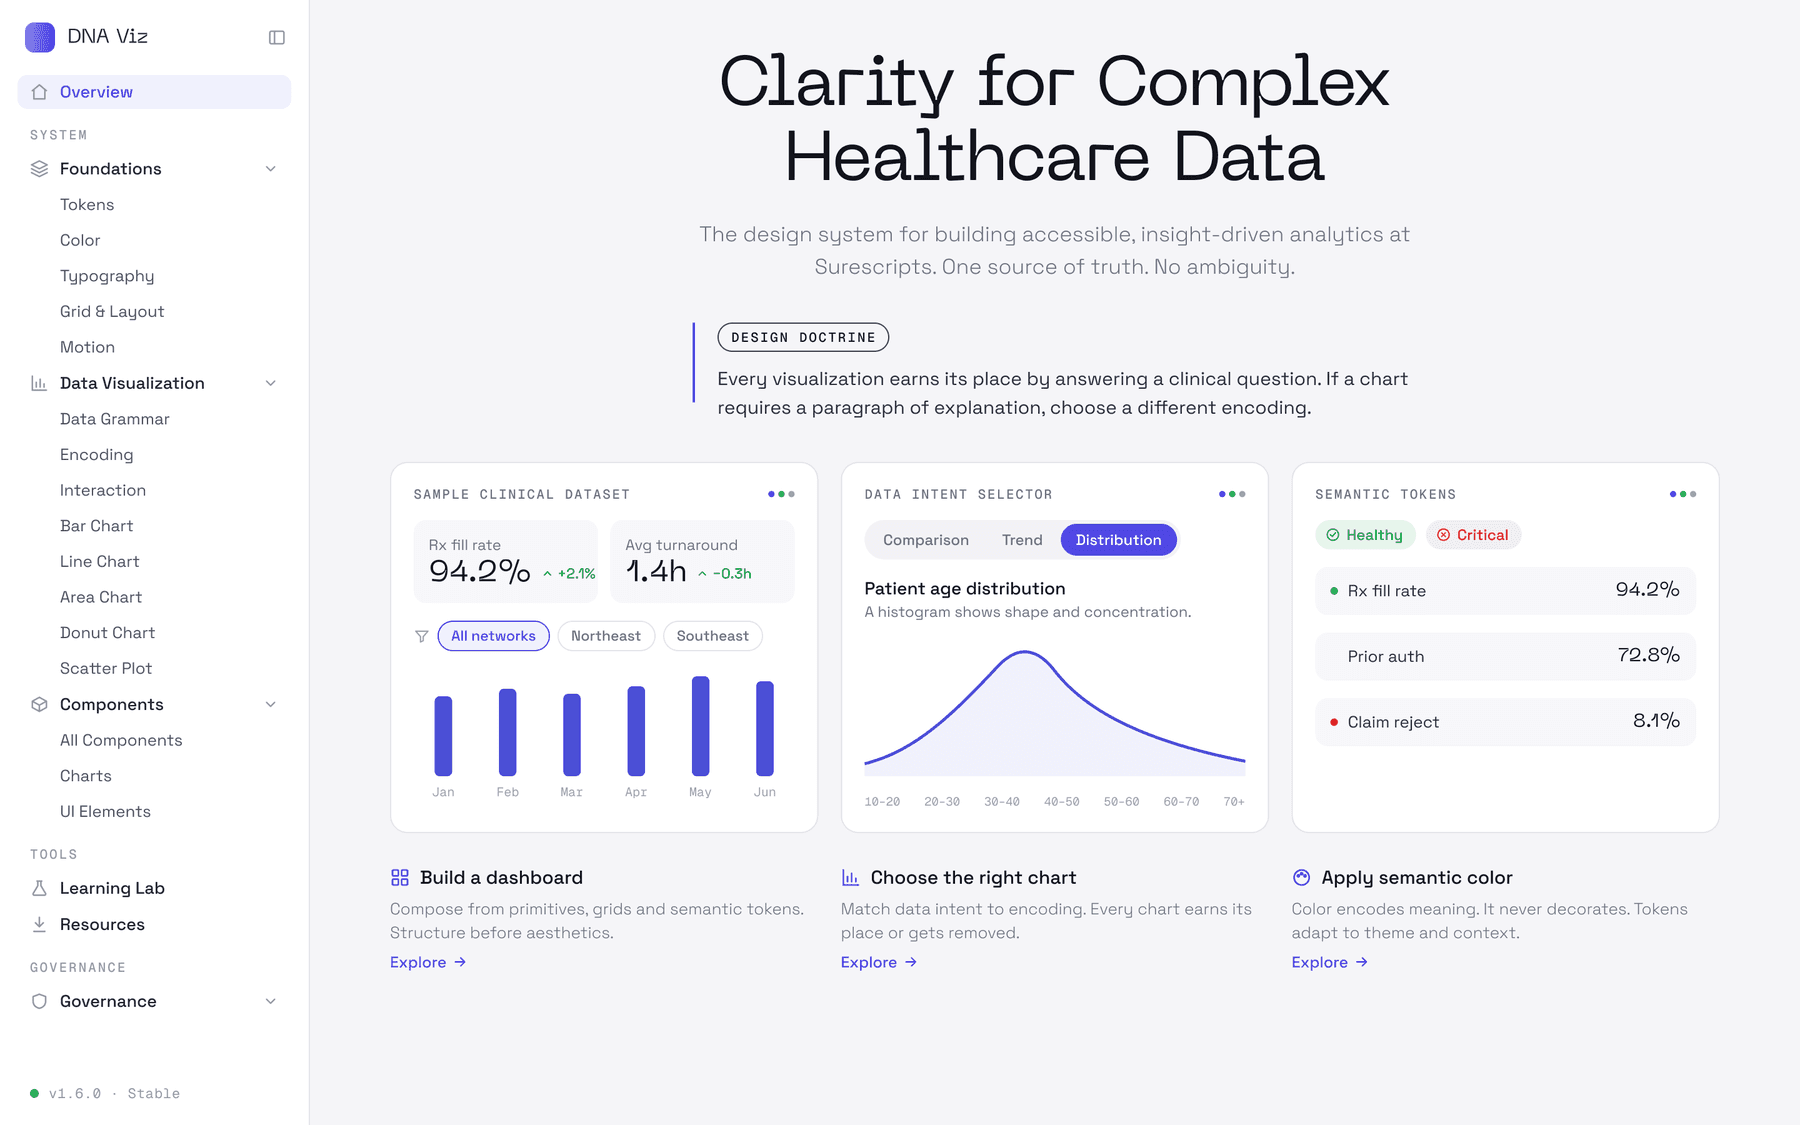
The same DNA Viz overview in the Light Premium surface

Two surfaces, same rules

DNA VIZ · LIGHT PREMIUM SURFACE

Two surfaces, same rules

Two surfaces, same rules

DNA VIZ · LIGHT PREMIUM SURFACE

Six layers, one direction.

Tokens sit at the bottom and governance at the top, and no layer reaches past the one beneath it.

DNA Viz architecture as six stacked layers: tokens, semantic roles, chart primitives, components, patterns and governance

Six layers, from tokens to governance

DNA VIZ · SYSTEM ARCHITECTURE

Six layers, from tokens to governance

Six layers, from tokens to governance

DNA VIZ · SYSTEM ARCHITECTURE

Color carries meaning. The question picks the chart.

The status scale adds a neutral Notable tier for a change that is worth a look but is not good or bad.

DNA Viz color: the dual surface palette and a five-tier status scale from Healthy to Critical, including a neutral Notable tier

Five tiers, from Healthy to Critical

DNA VIZ · COLOR

Five tiers, from Healthy to Critical

Five tiers, from Healthy to Critical

DNA VIZ · COLOR

DNA Viz data grammar: which chart to use for each kind of question, with encoding rules

Pick the chart by the question

DNA VIZ · DATA GRAMMAR

Pick the chart by the question

Pick the chart by the question

DNA VIZ · DATA GRAMMAR

Built in React. Taught in a playground.

19 production components ship as one package, and the Learning Lab lets anyone try a chart before building with it.

DNA Viz component library: React chart and interface components with a tooltip example
DNA Viz Learning Lab: an interactive playground for trying chart components and their settings
01 / 02
19 components, 5 of them chartsDNA Viz · Component library
Full size ↗

Put to work on real dashboards.

Four Surescripts dashboards were redesigned on DNA. Here is the prior-authorization funnel, before and after.

A prior-authorization funnel dashboard before and after its redesign on DNA Viz, with sample data
How DNA Viz shipped: package, tests, documentation and the handoff to enterprise UX
01 / 02
A prior-auth funnel, before and afterDNA Viz · Applied · Sample data
Full size ↗
0